
It’s not always easy to determine what end users who interact with data really need. The answer depends on the person you speak to – a salesperson, a product manager, a consultant and an R&D manager may have different opinions depending on technical limitations and business logic. The truth is that there is rarely a single requirement, and that the requirements change over time. To help you understand the challenge, this post describes the four categories of end users: Content Viewers, Data Discoverers, Content Creators, and Query Experts.
Content Viewers
These people typically look at data in static, paginated reports that include tables and some graphs. These reports can be converted to PDF or Excel files. Content Viewers may select filters to generate a report on demand, and can schedule the execution of reports. Interactive viewing allows Content Viewers to customize reports in a web interface by applying filters, adding aggregates and computing new columns from existing data. Different graphs with key performance indicators can be mashed up onto a landing page called a dashboard and used by Content Viewers.
Data Discoverers
This category of people consists of autonomous business users and managers that use dashboards to monitor performance, drill down to details and discover hidden relationships within their data. A dashboard consists of different elements (widgets or gadgets) that are linked, meaning a Data Discoverer can change a single selector and all corresponding graphs change as well. Data Discoverers often use advanced dashboard features such as performance management views, and have the capacity to “tell a story” with data. Visual data mining tools are also used by people in this category.
Content Creators
These people are business users and consultants who may have access to data sources, most often indirectly through a metadata layer. Different tools, preferably web-based, allow Content Creators to build visualizations, reports, crosstabs and dashboards. For more complex content and data modelling, Content Creators tend to use more technically oriented, standalone design tools.
Query Experts
These people are programmers who enjoy writing scripts or using a programming language to query data. All Query Experts need is a text editor or a database query tool. The data they work with may reside within an operational database, or may be pre-aggregated in an intermediate data warehouse. Mathematicians and statisticians who perform scoring or predictive algorithms on Big Data are also part of this category.
To put these categories into perspective, compare the type and number of users in this graph.
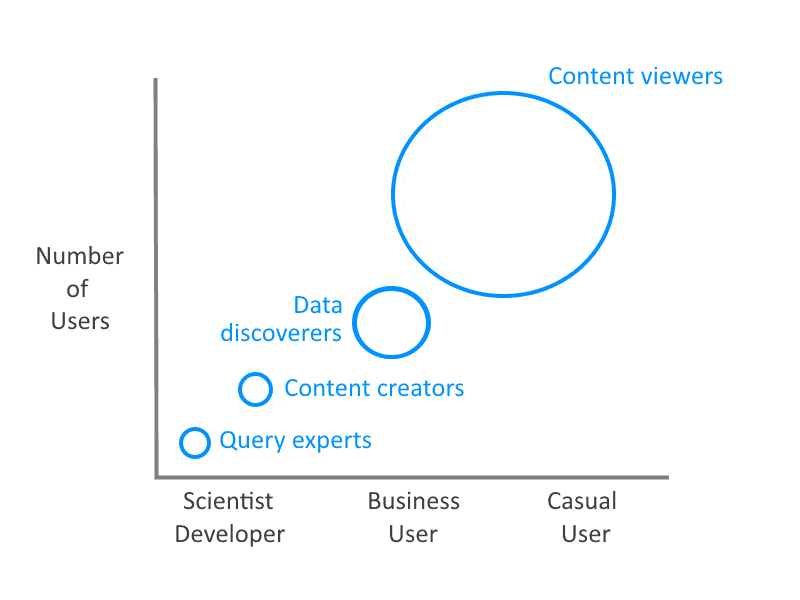
Here’s what you can take away from this graph:
- The Content Viewers are by far the largest user population. But that’s hardly a surprise; content viewing is part of hundreds of thousands of web applications.
- Technology progress tends to move from left to right, so tasks a data scientist does today will be accessible to casual users in a few years’ time.
- The capacity to cater to different user requirements within a single application is of key importance. The word application says it all: data visualization and exploration as an embedded, integrated solution, without the need for a stand-alone BI tool. (This is an “Excel-like BI” philosophy.)
My next post will discuss three key data-driven value propositions. Stay tuned.