“Can I have two different series types in a single chart in BIRT?”
Questions seem to come up on this subject fairly often. The answer: Yes, you can for certain chart types. In the simpler scenario where you define each series individually with the chart builder, it’s very straightforward in either open source BIRT or BIRT Designer Pro. Say you have a simple 2-series chart that looks like this:
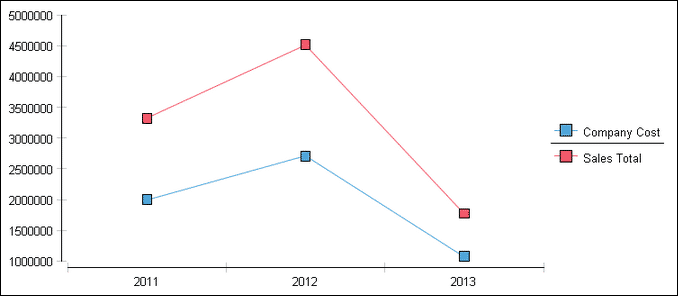
To change one of the series types in this instance, we can use the UI. Go back into the chart builder and go to the “Series” section. As seen in the image below, you can change the second series type to any other type listed in the drop down.
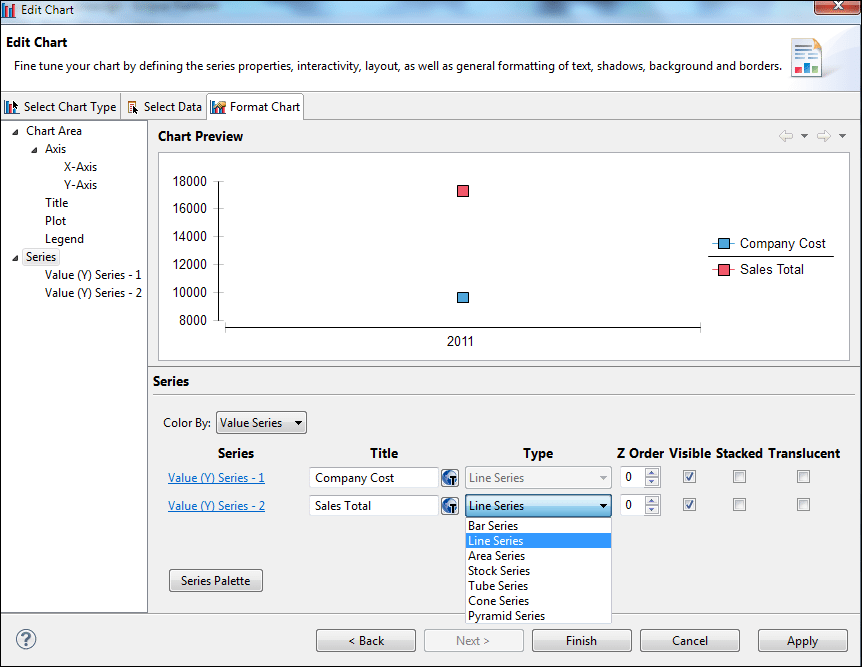
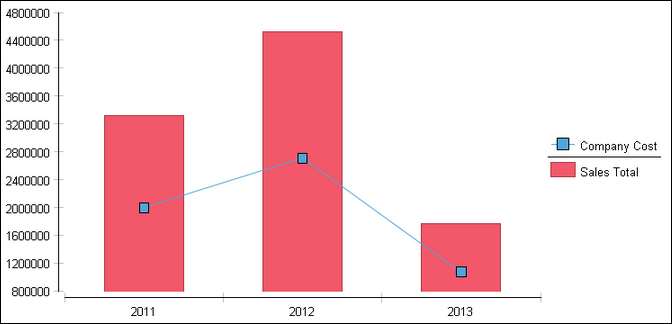
If we choose Bar Chart and set the z-order of the first series to 1 and the second to 0, we’ll get something that looks like this:
Now, what if we only have a single series defined from the chart UI but are using optional y-series grouping, which creates many series in the same chart? Can you still change the series type of a specific series? Sure. It’s just a little more complicated because you have to script it. In this scenario, we have a chart with date as the x-axis value, sales as the y-axis value, and have an optional y-series grouping value of product line. With multiple product lines in your data, multiple series will be created, as can be seen here:
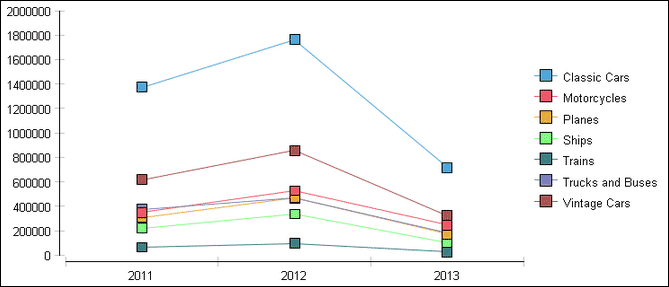
As stated above, we don’t have a UI option to change a series type because we have only defined a single series, so we have to go to script. Using the following script, we loop through the series in the chart til we find the one we’re looking for. In this case, we’ll change the “Vintage Cars” series. We grab the dataset and use it to create our bar series. Once the series is created, we can add it to the existing series definition.
importPackage(Packages.org.eclipse.birt.chart.model.data.impl); importPackage(Packages.org.eclipse.birt.chart.model.type.impl); function beforeGeneration( chart, icsc ) { yAxis = chart.getAxes()[0].getAssociatedAxes()[0]; seriesDef = yAxis.getSeriesDefinitions()[0]; for(i=0;i<seriesDef.getSeries().size();i++){ if(seriesDef.getSeries()[i].getSeriesIdentifier() == "Vintage Cars"){ ds = seriesDef.getSeries()[i].getDataSet(); } } ns = BarSeriesImpl.create(); ns.setDataSet(ds); ns.setSeriesIdentifier("Vintage Cars"); seriesDef.getSeries().add(ns); }
When we run the report, we get the following result:
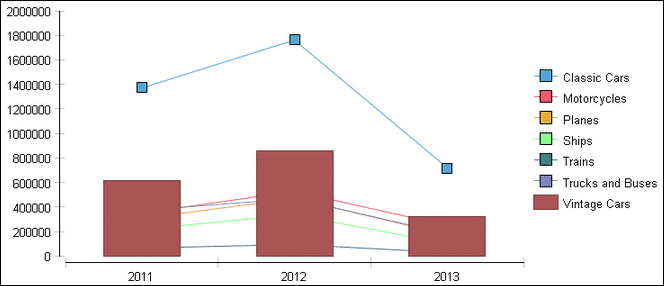
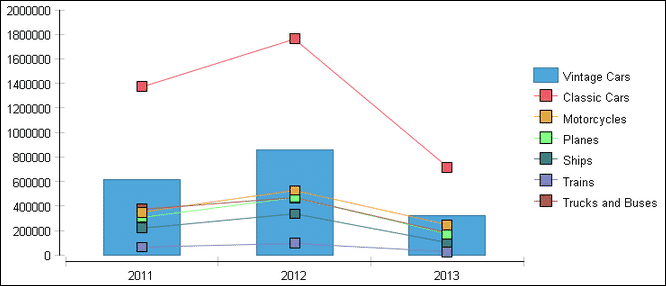
As you can see, we’re not quite there, yet. With the first example, we created multiple series with the UI, which created multiple series definitions, allowing us to change the z-order of each series. In this example, we’re using the same series definition, so we need to use the following line of script to move the new series to the front of the list to be sure it’s drawn first.
seriesDef.getSeries().move(0,ns);
Once we’ve done that, we get the desired result:
The design described in this blog post can be found in this devshare post. If you have questions on this subject, feel free to post questions/comments in the blog comment section or ask questions in the community forums. Thanks for reading.


