
Second in a series of blog posts on handy extensions to OpenText Interactive Viewer, a module of iHub.
In a previous Interactive Viewer extension, a few lines of jQuery code let you add row highlighting capability to iHub tables. In this post we extend that idea further, showing how to add a fully configurable pop-up dialog box to display details that don’t need to appear in every row.
Why would you want this? We’ve all worked with tables in which one column held so much text that every line in the report had tons of extra white space. This one column forced the table or report to be many more pages than necessary. Sometimes users who are scrolling through tables of data need a quick way to see detail on one record without leaving the table.
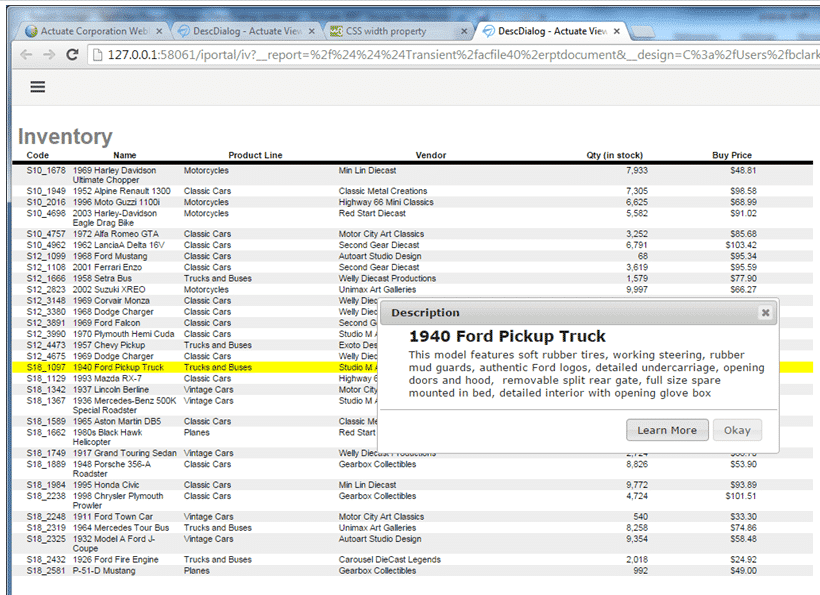
With this easy extension, all report rows are just one line and a pop-up dialog box gives a full item description (a longer block of text) in paragraph form. The user can click anywhere in any row to see the description. The result looks like this:
To add this effect to your tables, you just need to add a column that contains the contents of what you want to display in the pop-up and add some code (posted below) in a HTML text object in the table header.
Just follow these simple steps:
- Create a column to the left of the first column of your table. In our JavaScript code, we are going to traverse the DOM and place the contents of first cell of the clicked-on row in the pop-up.
- Add everything that you want to display in the description dialog to the detail cell of the first row. You can display multiple items in the first row. Make sure that the first row’s header is empty.
- For every element in the first cell in the table report layout, click on the general properties and change the display to “No Display”. This will change the CSS display properties to “none” so the element will not be visible – but the contents will still be accessible to jQuery.
- Make the width of the first row “.1 inch” or some other small number. The column display needs to remain “visible,” but the narrow width will keep it from being noticed by your users.
- In the clientScripts/clientInitialize script, add the following includes:
head.js("https://code.jquery.com/ui/1.10.4/jquery-ui.js","https://code.jquery.com/ui/1.10.4/themes/smoothness/jquery-ui.css",null);
- In the header of the first item in a row, add a text item and change the type to HTML.
- Cut and paste the following code into the text item.
<div id="descDialog" title="Description" style="z-index: 9999;display: none;">

    <span class="ui-state-default"><span class="ui-icon ui-icon-info"

style="float:left; margin:0 7px 0 0;"></span></span>

   <div style="margin-left: 23px;">

      <div id="descText">

         No description found.

      </div></div> <

/div>

<script type="text/javascript">
var allCells = $("#descDialog").closest("table").find( "td" );
allCells.click(function(){
var el = $(this);
// debugger;
$("#descText").html(el.closest("tr").children(':first-child').html());
$("#descText").find("div").css("display","block");
dialog = $('#descDialog')
.dialog({modal:false, buttons: {
"Learn More": function() {
console.log("Learn More");
window.open('https://www.google.com', '_blank')
},
"Okay": function() {
console.log("close dialog");
$(this).dialog("close");
}
}
});
$('div.ui-dialog.ui-widget.ui-widget-content.ui-corner-all.ui-front.ui-draggable.ui-resizable').css("z-index","99999");
});
/* Add this for alternating background colors */
allCells.parent().parent().parent().find("tr:odd").css("background-color", "#EEEEEE")
allCells.parent().parent().parent().find("tr:even").css("background-color", "")
allCells
.on("mouseover", function() {
var el = $(this);
el.parent().css("background","#FFFF00");
})
.on("mouseout", function() {
/* No Background color */
//allCells.parent().css("background","");
/* Alternating background color */
allCells.parent().parent().parent().find("tr:odd").css("background-color", "#EEEEEE")
allCells.parent().parent().parent().find("tr:even").css("background-color", "")
});
</script>
As you can see in the above code, the description dialog box is a div with the id “descDialog” and the div with the id “descText” has its HTML updated with the contents of the first cell of the clicked-on row in the JavaScript on click event.
If you do not want alternating background colors or row highlighting, just remove the relevant code from the JavaScript block.
Like the Row Highlight extension, this method lets you can add functionality to new or existing reports very easily. It’s simple to change colors, type styling, and other aspects of the pop-up dialog to match your existing UX. All other Interactive Viewer functions (like sorted columns) are unaffected.
This example, and the others to come, show how extending Interactive Viewer is a snap thanks to the OpenText Analytics JavaScript API. You can create any visualization imaginable using a resultset that you can access with a single JavaScript API call.
This series of free Interactive Viewer extensions was created by BIRT engineers Clement Wong and Bill Clark. Interactive Viewer is ideal for putting personalized report content in all users’ hands, and their goal with these extensions is to make it even better.
Other blog posts in this series: