Last Monday’s Presidential Debate was a history of firsts: it was the first time Hillary Clinton and Donald Trump appeared on stage together for a head-to-head debate; it was the first to feature a female presidential candidate; it was the first to be live streamed in its entirety; and for the first time, viewers were able to monitor news media reactions as they occurred using Election Tracker ’16.
![]()
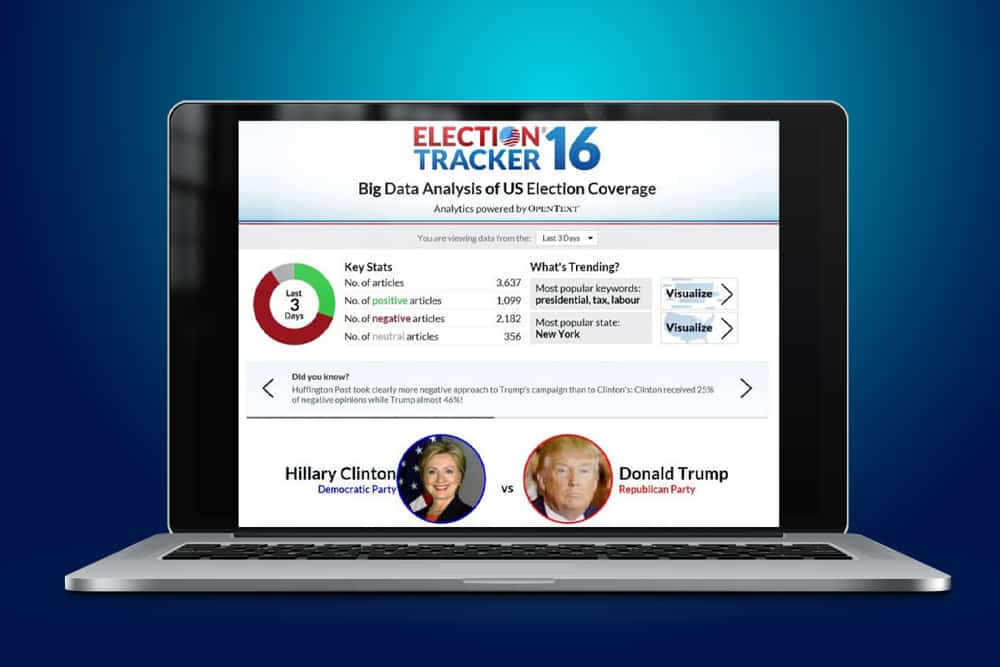
Election Tracker ’16 Dashboard
Back in February, I announced the release of Election Tracker ‘16—an online application that allows users to visually monitor, compare, and gain insight into the 2016 U.S. Presidential Election coverage. For this election, the tool analyzes text from more than 400,000 online articles and displays associated sentiments based on summaries of topics and tones of coverage in a dashboard. This includes coverage of last Monday’s debate.
Election Tracker ’16 demonstrates the power of predictive analytics and sentiment analysis. Leading up to the debate, we were able to predict that candidates would cover topics like foreign policy, terrorism, campaign finance, immigration, and armed forces based on the most popular keywords that the media has covered. The coverage of each topic is displayed by Election Tracker ’16 (as shown below).
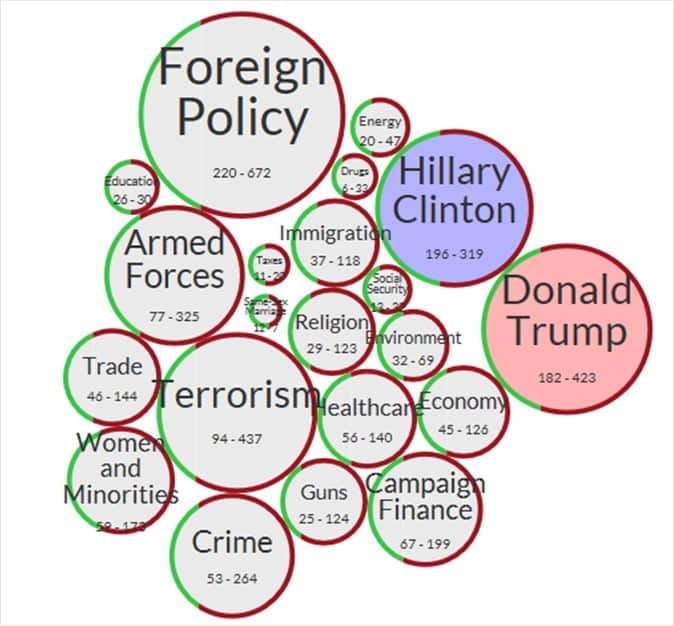
Coverage of Candidate Topics
The Election Tracker ’16 dashboard allows users to compare topics by candidate according to media mentions. The candidates’ top topics can be accessed and filtered by media sentiment. An overall breakdown by media mentions is also available.
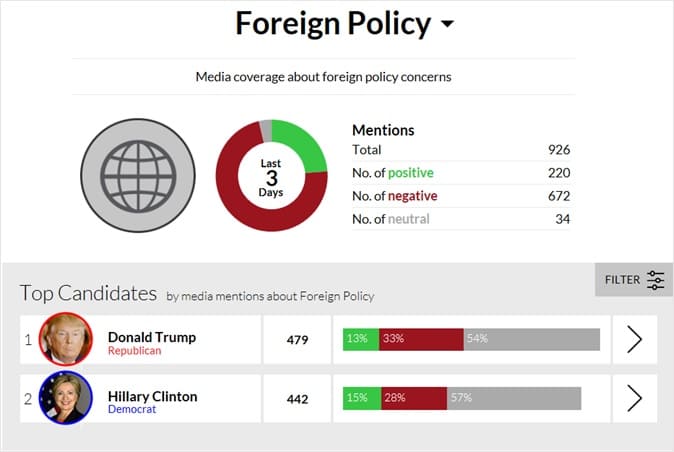
Comparison of Media Sentiment
The application also serves up interesting “Did You Know” facts related to campaign coverage. For example, “Huffington Post took clearly more negative approach to Trump’s campaign than to Clinton’s: Clinton received 25% of negative opinions while Trump almost 46%.” Overall positive and negative sentiment percentages for each candidate are also displayed.
In what is proving to be a data-driven race for President, Election Tracker ’16 reveals media reactions to campaign rhetoric, analyzing sentiment to unlock insights hidden in the unstructured data. It is a working example of how complex data can be transformed to provide unique insights, and a great showcase of the power of analyzing unstructured big data—which is becoming an increasingly common business requirement across all industries.
The application of sentiment analysis extends well beyond the presidential election. The right analytics technology allows organizations to analyze both structured and unstructured information within the framework of real-world implications. They can then identify what happened and why, resulting in a deeper level of understanding that enables a more cognitive—or human—way of thinking.
Applications like Election Tracker ’16 will help transform organizations into cognitive enterprises, enabling them to know their customers and processes better, and manage their business through actionable insights that accurately predict potential outcomes—such as what a customer will likely buy… or who the next U.S President will be.
Check out Election Tracker ’16 to find out what the media is saying about each candidate during key election milestones.