Don’t pay more to see more: OpenText delivers Application Observability with OpenTelemetry at a reasonable cost

Introducing OpenTextTM Application Observability, a new SaaS solution to deliver logs, metrics, and traces for cloud-native and traditional applications instrumented with OpenTelemetry. Application Observability helps cloud operations teams, Site Reliability Engineers (SRE), and central IT teams detect and manage performance issues quickly and efficiently. The OpenTelemetry standard allows portability across toolsets that enables expanded observability across teams without impacting existing processes.
What is OpenTelemetry?
OpenTelemetry is an open-sourced project that provides a vendor-neutral instrumentation technology for collecting telemetry data, including metrics, traces, and logs regardless of programming language or platform so you can analyze all data in a single view. This standardized approach not only streamlines instrumentation but also defines and correlates all telemetry data. One of the biggest benefits of OpenTelemetry is it creates portability so developers and central IT can switch and choose the best-suited toolsets that are appropriate for their roles.
Learn more about OpenTelemetry >
Why do IT admins need Application Observability?
Without a method of capturing all the various components spread across a multi-cloud, hybrid IT world, IT administrators don’t have access to all the data they need to respond to application slowdowns quickly. IT admins use cloud resources and have responsibility for maintaining cloud apps, just as much as the cloud operations teams and SREs do. Central IT can’t stay in the world of responding to app slowdowns by just opening tickets. The business demands that IT admins need to understand where failures are coming from to triage the failures appropriately.
With Application Observability, IT admins have visibility into traces to find the module of code that’s the culprit of an application issue. This empowers IT admins to provide vital context to the developer to ultimately solve the problem. The result is getting to the core issue and assigning the right subject matter experts to fix the problem faster.
Pinpoint application performance issues fast
Application Observability helps you visualize the chain reaction of transactions so you can holistically understand the transaction dependencies. For example, we received a synthetic alert indicating a transaction failed in a cloud-native environment. Application Observability provides you with a service map that displays the microservices of your application and a service list. The size of the services indicates the throughput or efficiency of data transmission. From here, you can sort the services according to the number of errors and throughput.
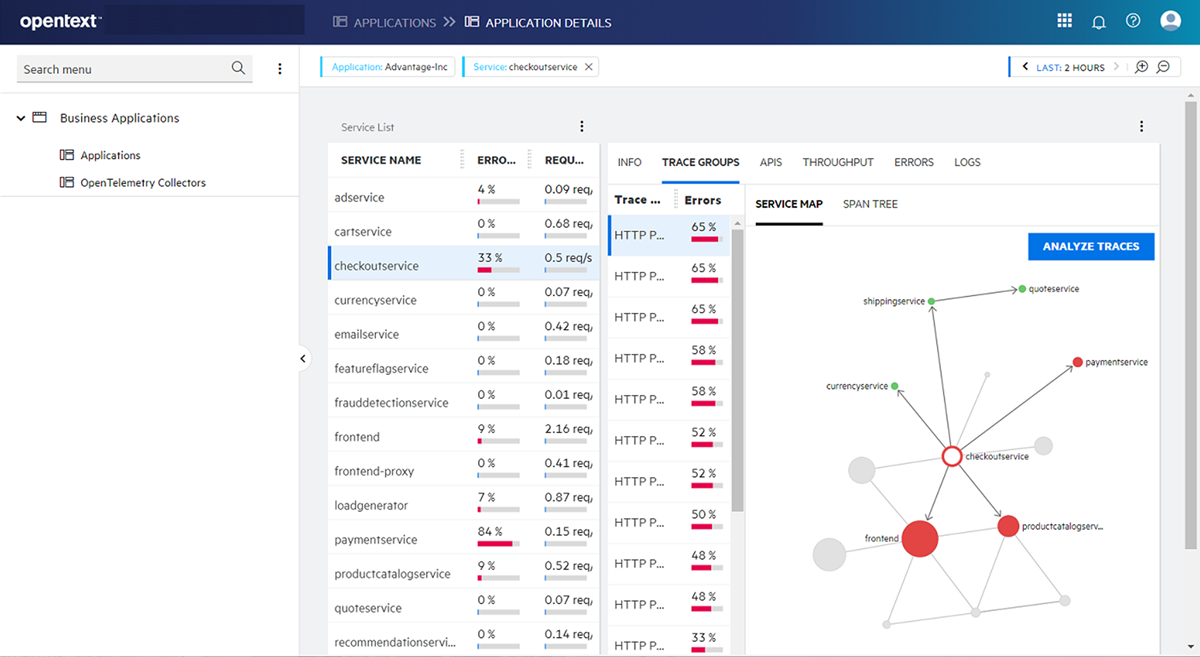
Once I select the checkout service, I can switch to the Trace Group tab. A trace group is when a single user action triggers multiple, interconnected transactions across different services. In our example, a user initiates a purchase, which involves interacting with multiple services for payment processing. All the traces related to this checkout process would be grouped under a single trace group. From the Trace Groups tab, you can sort the trace groups according to the number of errors, throughput, and latency.
Once I select my trace group (when a single user action triggers multiple, interconnected transactions across different services) with errors, I can use the Analyze Traces button to get a deeper insight into the Traces pages. Here I can see how many traces had errors, the trace details, and the span details (supplementary information beyond the core elements of a span) within a trace.
You can select a certain span to understand the span details. Span details show span attributes such as call status, error codes, and other attributes the developer instrumented, and span events. Here you can find the trace that triggered the current one, providing context for its execution.
To investigate further into the logs, you can examine the log messages that were logged during the trace.
In our example, span details indicate that the product catalog service returned an error. The log message shown in Figure 2 tells us that there was a problem in preparing the order because the product could not be found.

Application Observability provides useful entry points that help explore the application and gain visibility into the inner workings of the system, especially about the throughput and latency of services and APIs. By intelligently correlating and filtering logs based on specific trace stacks, you can go from sifting thousands of logs to focusing on the relevant logs (in our example, only 7 relevant logs) saving time and pinpointing root causes faster.
Get started with Application Observability
Whether you’re using our existing APM solutions or looking to uplevel your IT administrator capabilities, Application Observability can deliver for your organization.
If you want to learn more about OpenTelemetry, check out this webinar or contact us directly.