Enlightened leaders take the feelings and interests of their people into account. But how can you tell what they’re thinking, about myriads of subjects? Elections are yes/no questions without nuance. Opinion polls are time-delayed and limited in how much they can ask. And letters are labor-intensive to process.
Nowadays, the usual way to take the pulse of the public is to look at what they’re saying – in digital communications to their representatives, news, or social media. The challenge is how to read through millions of words and accurately sum up what they’re about, without throwing a whole office full of aides at the problem.
Do tell
Canada is facing that challenge as it hosts the annual Group of Seven economically advanced nations’ conference June 8 and 9. The Government of Canada wants to encourage citizen engagement with the five global hot topics the G7 countries will discuss at this year’s summit. (The topics are economic growth, gender equality, climate change, peace and security, and training for the jobs of the future.)
So the G7 organizers have turned to OpenText™, a proud Canadian company, for help displaying and analyzing public opinion on those topics, in a format that’s easy to use and share. (Hashtag #myG7 and #monG7.)
Personalized coverage of the G7 issues
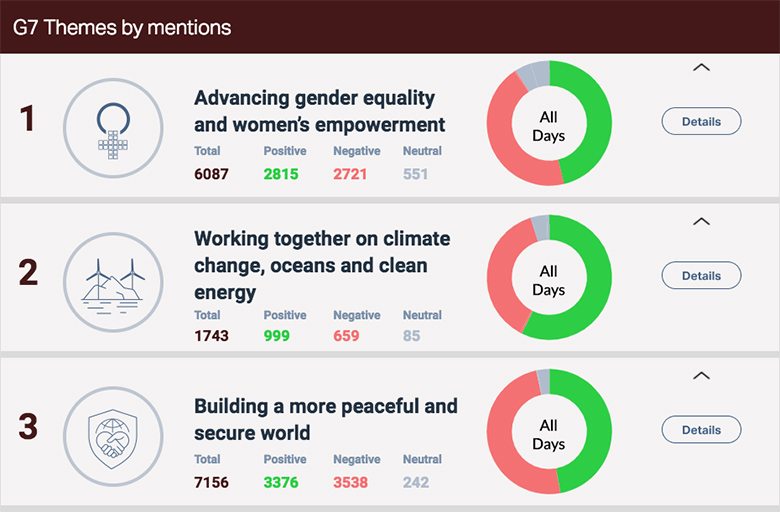
The solution OpenText created is “My G7,” a self-service online dashboard that lets you see, in near-real time, what public opinions on these major issues sound like.
Digesting thousands of articles and tweets of news and social media commentary every week, the My G7 site lets you visually monitor, compare, and discover interesting facts around global opinions of the 2018 G7 Summit’s topics. It can show you what the public is saying — by topics and keywords, countries, dates, and even tone of the coverage (positive, negative, or neutral).
You can see at a glance how the discourse changes from country to country or over time and what terms are “topping the charts” — useful insights into the summit’s discussions.

How it works
MyG7.ca is built using OpenText™ Magellan™, an AI-powered analytics platform that combines open source machine learning with advanced analytics, enterprise-grade BI, and the ability to acquire, merge, manage, and analyze Big Data and Big Content in a wide range of formats.
The Magellan application automatically crawls the web for G7 Summit focused articles and tweets in both French and English, and retrieves the raw text for evaluation.
The text mining module within Magellan processes the text to identify people, places and topics, following taxonomies (classification structures) that help the software organize and interpret the various terms it encounters.
The OpenText team that created the G7 tracker gave it a custom taxonomy. Although Canada picked the top five topics, sub-topics (such as “human rights” or “hunger”) were generated from the raw text the tracker had already consumed.
Sentiment analysis: That’s great, juuust greeaat
At the same time, Magellan determines the subjectivity and sentiment or tone of the article in question, using powerful, proprietary OpenText technology. (“Subjectivity” refers to whether an article/tweet is factual or presenting an opinion, while “tone” refers to its mood – positive, negative, or neutral.)
It’s even sophisticated enough to interpret sarcasm, emojis, and other nuances. 😲
Visualizations: I see your point
The tracker’s findings are then rendered as colorful, interactive charts and visualizations (from bar and ring charts to word clouds), making them easier to take in at a glance. Magellan’s JavaScript API (one of many APIs built into Magellan) seamlessly embeds the visuals into web pages.
With just a few clicks, you can alter the parameters to analyze the G7 coverage by the numbers, tone, theme, country, or time frame, and see what changes. Or pursue your own interests to find unique insights.
Showcasing the power of unstructured data
The G7 tracker is the latest in a series of online tools OpenText has built to showcase our ability to analyze unstructured data (mainly text, in contrast to structured data such as numbers in databases). We started 2 1/2 years ago with Election Tracker, which looked at news coverage of the 2016 U.S. Presidential Election.
OpenText knows making sense of unstructured content is a challenge for many organizations. Whether it’s spotting clues in insurance claims that could indicate fraud, searching for patterns in contracts that could help a company negotiate more consistent, profitable deals, or taking the temperature of consumer sentiment about product changes, companies want content analytics solutions that are more precise and more scalable than “assign a bunch of low-level employees to read through stacks of documents and make notes based on subjective impressions.”
The Magellan Text Mining module brings at least three big advantages to solving that problem:
- Smart, automated text analytics. Just as Magellan can swiftly sort through, classify, and make sense of millions of G7 comments, it can do the same with millions of documents, memos, emails, tweets, or claim forms.
- Interactive visualizations. We humans are visual creatures, so we perceive relationships and patterns much faster through images than words and numbers. OpenText Magellan offers many ways to focus on just the data set you want, and visualize it in ways that make sense to you. No data science degree needed!
- It’s scalable and embeddable. Magellan’s technology platform can handle even the largest data sets and heavy peak demand. And a wide range of APIs means you can embed its capacities into nearly any business application or website, whether desktop or mobile, under your own branding.
For more information on Magellan, contact us.


